How to Add RAM Metrics to EC2 Instances
Learn how to add RAM metrics to AWS EC2 instances for better performance monitoring. This step-by-step guide covers enabling CloudWatch custom metrics to track memory usage effectively.
Step 1: Create and Configure IAM Role
A new
cloudwatch_fullaccess IAM role should only be created if one doesn't already exist.
As of Feb 12, 2025, this role has already been created in GRO's AWS account.
- Log in to AWS.
- Click on (or search for) IAM.
- Under Access management, click Roles.
-
Create an IAM role named
cloudwatch_fullaccess. - Attach the following policies to this role:
-
CloudWatchFullAccess -
AmazonSSMFullAccess
-
Attach the
cloudwatch_fullaccessrole to your EC2 instances.
Step 2: Download and Install CloudWatch Agent
- Access the Instance via SSH:
ssh -i /path/to/key.pem ec2-user@<EC2_IP>
Example: ssh -i “~/.ssh/gro-ec2-ohio.pem” [email protected]
- Change to /tmp directory:
cd /tmp
- Download agent to /tmp directory:
wget https://s3.amazonaws.com/amazoncloudwatch-agent/ubuntu/amd64/latest/amazon-cloudwatch-agent.deb
- After downloading, install the agent with:
sudo dpkg -i amazon-cloudwatch-agent.deb
If you encounter dependency issues, run:
sudo apt-get install -f
- Verify installation and check if the package was installed successfully:
dpkg -l | grep amazon-cloudwatch-agent
Step 3: Configure and Initialize CloudWatch Agent
- Run the following command to start the configuration wizard:
sudo /opt/aws/amazon-cloudwatch-agent/bin/amazon-cloudwatch-agent-config-wizard
Alternatively, you may download a preconfigured JSON file by clicking this link.
Once downloaded, you'll need to unzip and upload the config.json file via Terminal to the
/opt/aws/amazon-cloudwatch-agent/bin/ folder on the server.
Once completed, the configuration will be saved at: /opt/aws/amazon-cloudwatch-agent/bin/config.json
- After configuring, start the agent using:
sudo amazon-cloudwatch-agent-ctl -a fetch-config -m ec2 -c file:/opt/aws/amazon-cloudwatch-agent/bin/config.json -s
This will Apply the configuration and Start the CloudWatch Agent as a service.
- Verify the agent is running by checking the status using:
sudo systemctl status amazon-cloudwatch-agent
You should see an Active (running) status if it’s running.
- To ensure the agent restarts automatically after reboots:
sudo systemctl enable amazon-cloudwatch-agent
Step 4: Add and Verify Metrics in CloudWatch
- Go to the AWS Management Console.
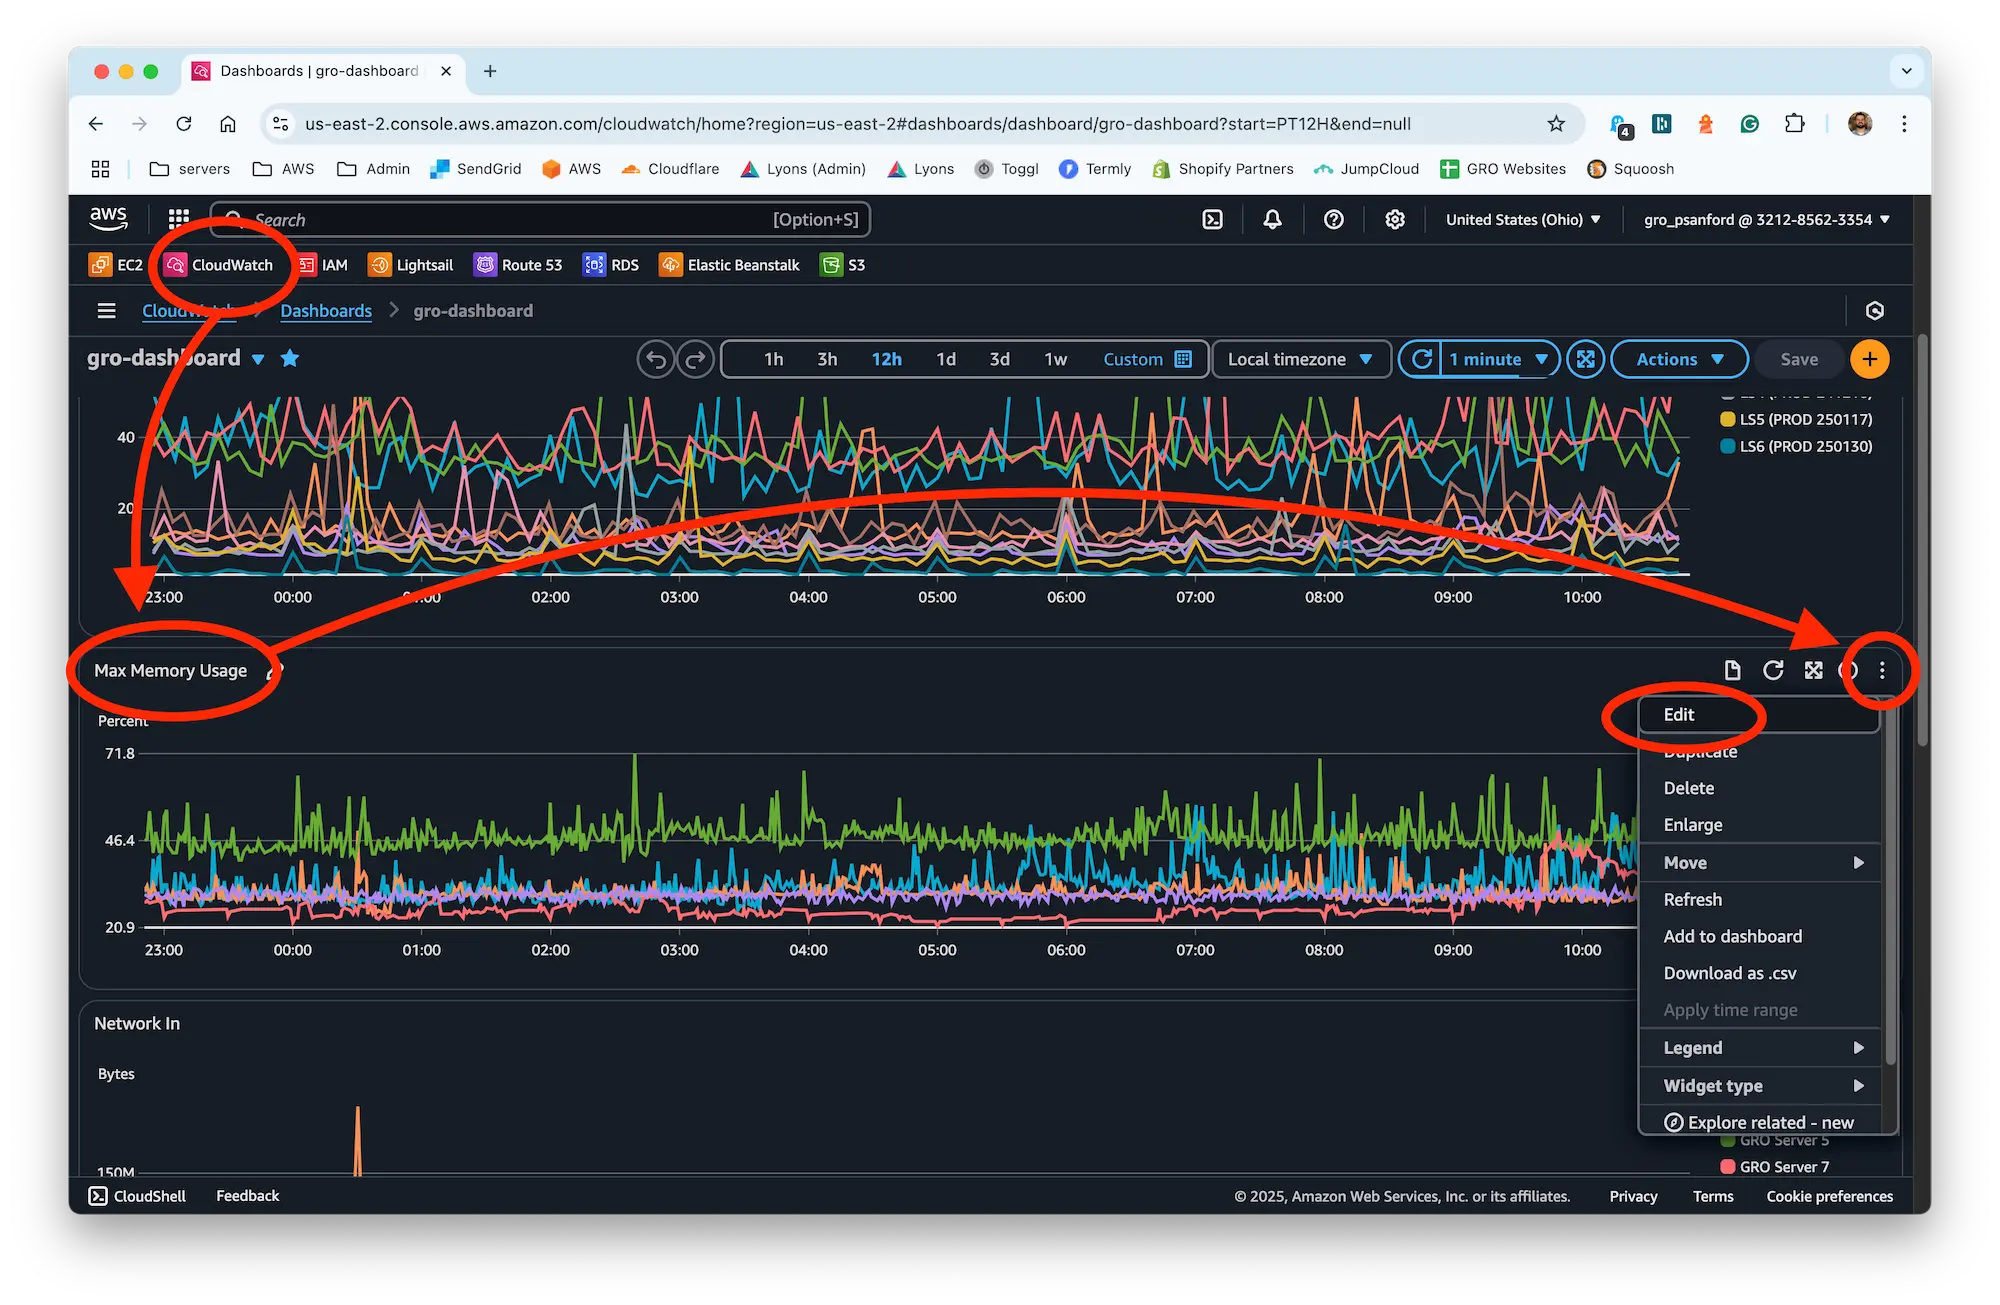
- Navigate to the CloudWatch service.
- Click on Dashboards.
- Click on gro-dashboard.
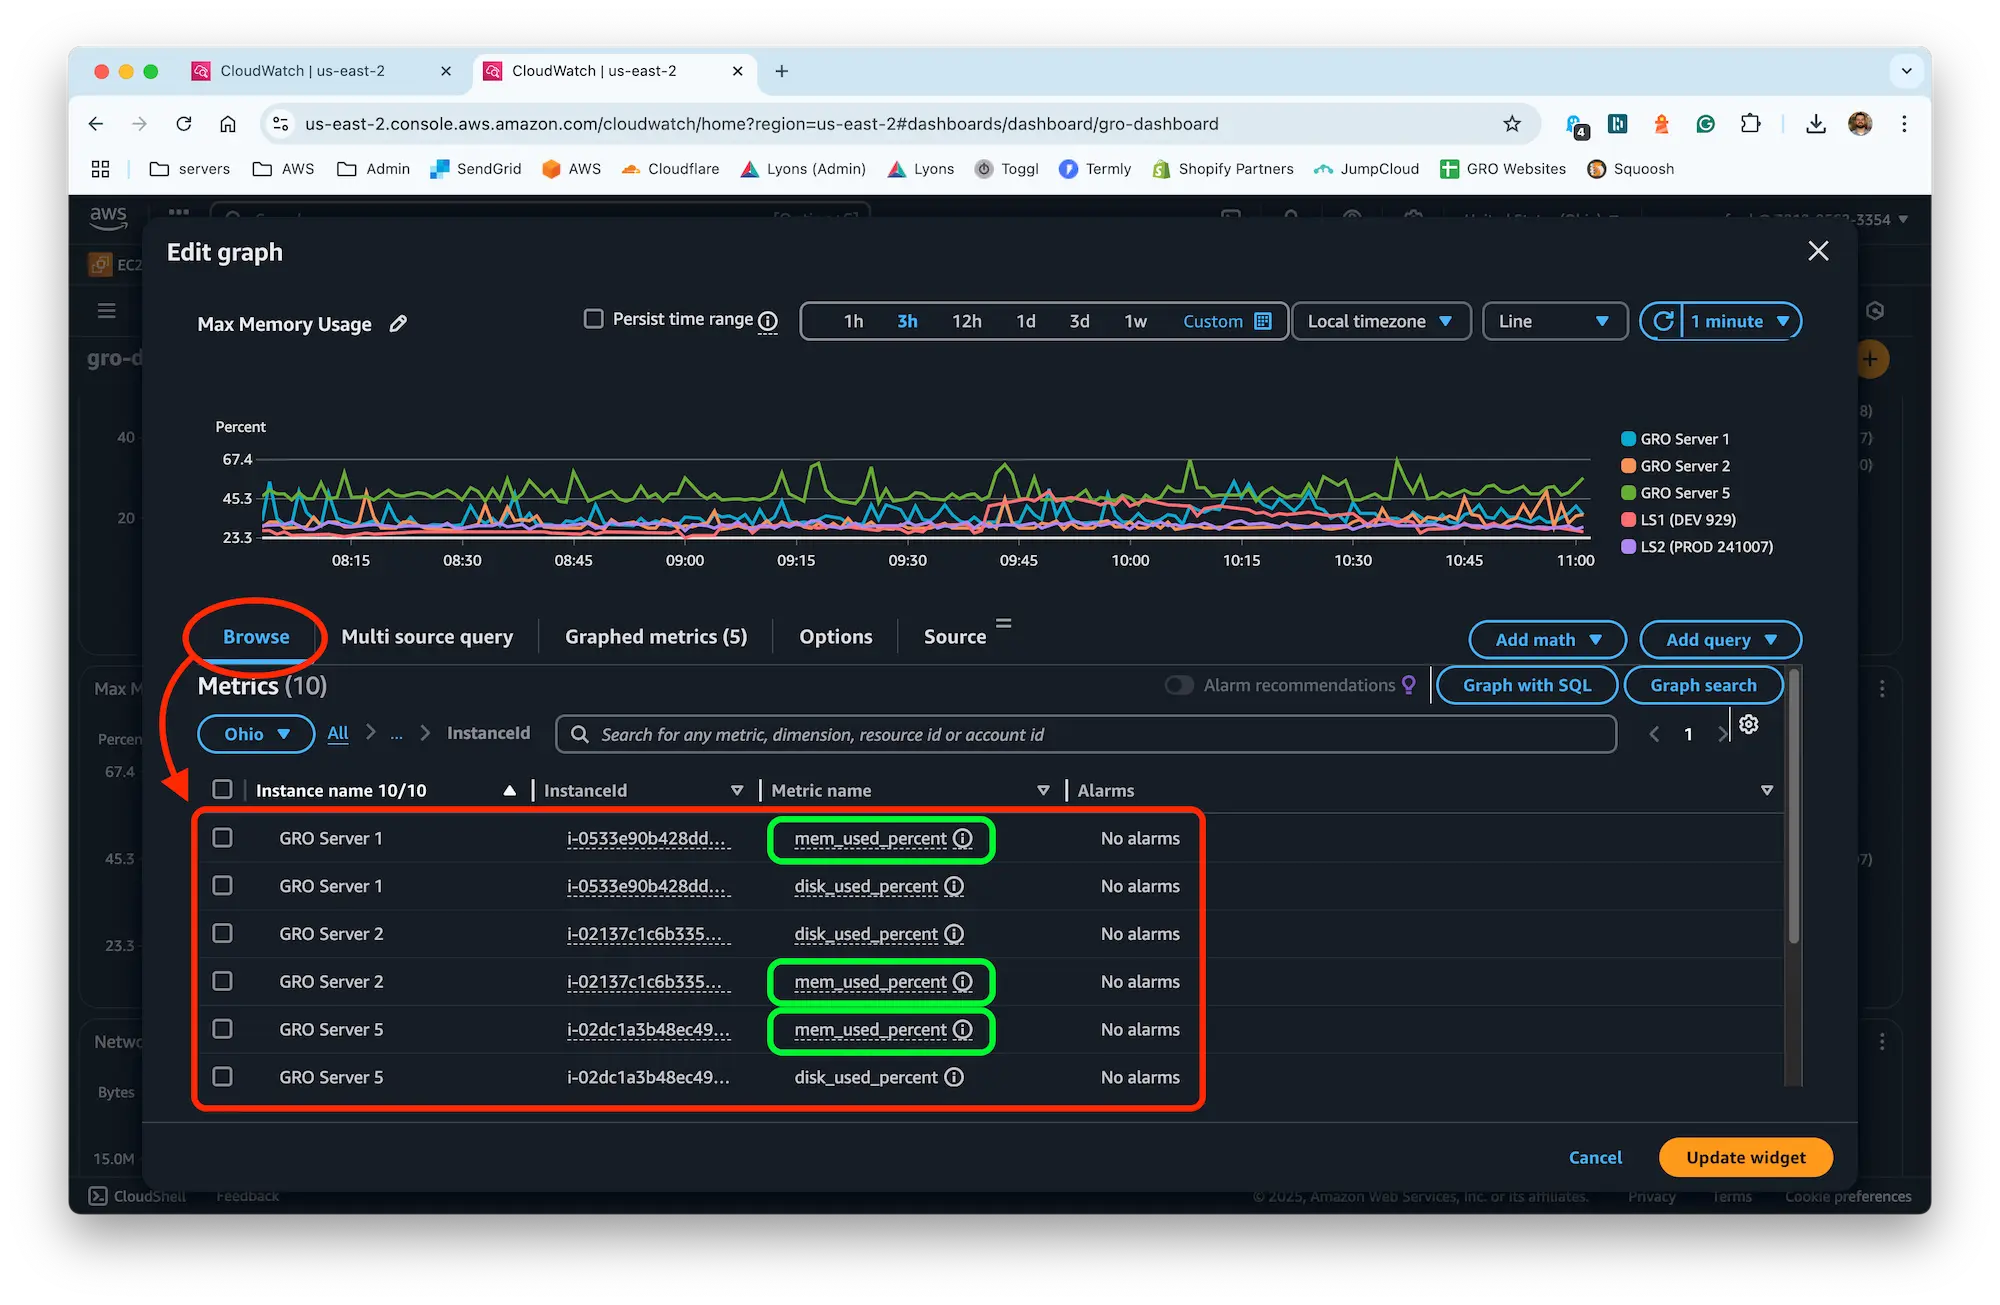
- Scroll down to the Max Memory Usage panel and click the 3 dots in the upper-right to Edit.
- Click Browse.
- Under Custom namespaces, click CWAgent.
- Click InstanceID.
- Select the Instance you want to add to the chart, making sure the Metric name is mem_used_percent and click Update widget.
- Finally, don't forget to click the Save button in the upper-right of the dashboard.